

HUDCO Ltd.- Stock Investment Idea Weekly Pick

HUDCO Ltd. is showing signs of trend resumption after a deep corrective phase and a strong bounce from the long-term trendline support near the 100-week EMA. Price sustaining above anchored VWAP, bullish weekly candle, and RSI recovery across timeframes signal improving momentum, positioning the stock for a medium-term swing revival.
Expert recommendation by Mr. Ketan Kaushik - Derivative Analyst (NISM - 202200162803)
- Current Price: 222
- Buying Price: 215-225
- Target Price: 250-280
- Stop loss: 195
- Upside: 26%
- Timeframe: 8–10 weeks
Stock Technical Analysis
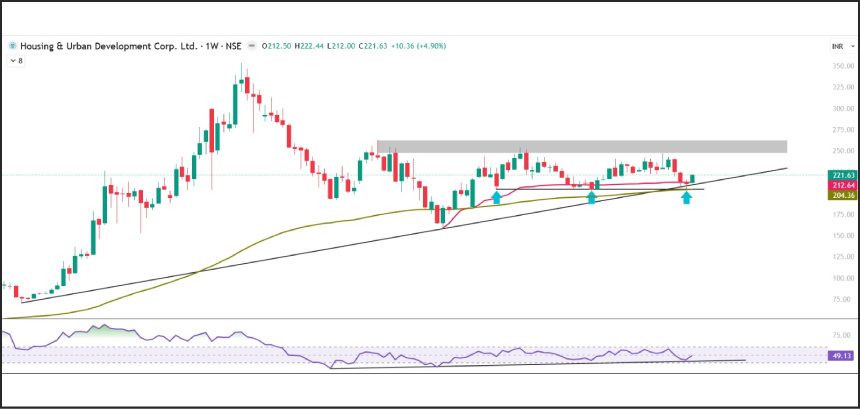
- The stock witnessed a sharp up move from the 152 level and made an all-time high of 353 in Jul24; after making the high, Stock retraced and took support in the 160-180 zone
- Stock has bounced from trendline support level which is also merging with 100 week exponential moving average.
- Stock is sustaining above the anchored VWAP which indicate indicating buying interest and it has also closed with a bullish candlestick formation on the weekly chart
- The momentum indicator RSI has bounced from the 40 level on both daily and weekly time-frames, suggesting that upside momentum is likely to continue in the coming days
Traders can look to accumulate HUDCO using precise limit orders in the 215-225 zone and expect upside targets of 260-280 over the next 8-10 weeks, with a stop loss below 195 on a closing basis.
💡 Learn to find more such setups with our swing trading guide to stay ahead of market opportunities.
Know more about HUDCO Limited.
Website: https://www.hudco.org.in/
Housing & Urban Development Corporation Ltd (HUDCO) is a government-owned financial institution focused on funding housing and urban infrastructure projects across India. It plays a key role in affordable housing, smart cities, and urban development financing, with a strong PSU-backed balance sheet.
HUDCO Ltd. Swing Trading – FAQs
HUDCO has returned to traders’ radar after stabilizing near long-term demand zones. Below are key questions to help investors understand the strength and structure of the current swing setup.
Is HUDCO suitable for swing trading at current levels?
HUDCO is showing a favorable swing structure after bouncing from trendline support aligned with the 100-week EMA and sustaining above anchored VWAP.
Which technical factors support the bullish view?
The setup is supported by a bullish weekly candlestick, RSI bouncing from the 40 level on daily and weekly charts, and price holding above VWAP.
Why is the 160–180 zone important?
This zone acted as a major demand area after the post-all-time-high correction and coincides with long-term trendline and moving average support.
What timeframe does this swing setup target?
Based on momentum recovery and structural confirmation, the move could unfold over the next 8–10 weeks, subject to broader market conditions.
What should traders track going forward?
Traders should monitor price sustainability above anchored VWAP, continuation of RSI strength, and follow-through buying on higher volumes.
Before You Trade, Strengthen Your Foundations with These Guides
- For a stronger understanding of indicators such as RSI, VWAP, and trendlines, check our 👉 Technical Analysis Fundamentals section.
- Want to refine your risk-reward planning? Explore our insights on 👉 Position Sizing & Risk Management Strategies.
Disclaimer: - Investments in securities market are subject to market risk, read all the related document carefully before investing. https://www.mnclgroup.com/research-disclaimer