Stock picking, and the effort along with the thought you put into it, is what separates investing from gambling.
It’s not about chasing hype, copying what your friends or neighbours are buying, or going with the brands you see most often. Real investing is rooted in thoughtful stock analysis—an approach that helps you make decisions based on insight, not instinct.
Stock analysis is both an art and a science. It involves evaluating a company's financials, tracking stock charts, interpreting market sentiment, and sometimes even running mathematical models.
The goal? To build conviction before you commit capital.
In this guide, we break down the major stock analysis techniques: fundamental analysis, technical analysis, quantitative models, and sentiment and news analysis. We also walk you through the best tools, resources, and mistakes to watch out for so you can build a sharper, smarter top stock research strategy.
Fundamental analysis dives into a company’s intrinsic value by examining what the business does, how it earns money, and whether it’s priced attractively.
Start by exploring core questions like:
A clear grasp of the business model helps in identifying sustainable, high-quality businesses.
Review the three pillars of company financials:
Balance Sheet: Provides the snapshot of assets and liabilities. Cash Flow Statement: Shows the sources where the company’s money is flowing to and from.
Financial ratios are a quick way to gain an understanding of the company’s financial strength:
These ratios inform whether a stock is undervalued, overleverage, or efficient.
Numbers alone don’t tell the full story. Consider factors like:
Qualitative analysis complements the financial ratios and often separates winners from the lot.
Several approaches help estimate value; one isn’t enough. Look at:
Unlike fundamental analysis, which looks at what a company does, technical analysis focuses on what the stock price is doing. It’s all about spotting patterns in price and volume to decide when to buy or sell.
At the heart of technical analysis are price charts. The most common one you'll come across is the candlestick chart, which shows how a stock’s price moves within a specific time period—its open, close, high, and low.
Over time, these charts form patterns, almost like footprints of investor behaviour. Some patterns suggest a trend is about to reverse (like the head and shoulders or double top), while others hint at a continuation (such as triangles or flags).
Learning to recognise trading chart patterns can help you spot potential entry and exit points with more confidence.
Charts tell one story, but technical indicators add another layer of insight. These are formulae that analyse price or volume data to help you spot trends, momentum, or volatility.
Here are the essential ones:
Some price levels act like invisible walls. Support is the level a stock tends to bounce up from. Resistance is the level it struggles to break above. These zones can help you set price targets or stop-losses when planning trades.
One key question to always ask: Is this stock trending or moving sideways?
Spotting trends early, and knowing when they’re weakening, is one of the core skills technical traders rely on.
If fundamental analysis looks at what a company is worth, and technical analysis looks at price patterns, quantitative analysis is all about the numbers. It uses data, statistics, and sometimes algorithms to find patterns, build strategies, or test ideas.
Think of it as using a checklist made of numbers. For example, let’s say you want to find companies with:
Using a stock screener, you can filter hundreds of companies based on these criteria in seconds. That’s a basic form of quant.
Quantitative tools help you:
It’s like setting up your own system. And once you get the hang of it, it can help you stay consistent and objective, especially in a market that’s full of noise.
Stock prices aren’t just driven by data—they’re influenced by emotions, headlines, and hype. Here’s how to make sense of it:
Tools such as sentiment-scoring platforms or real-time news aggregators help you stay ahead. When it comes to sentiment and news analysis, don’t just follow the crowd—understand what’s fuelling it.
There’s no single way to analyse stocks; each method offers a different lens. Some look at company fundamentals, some read charts, others follow market sentiment or run data models.
The key is to mix what works for you. Use a balance of tools and insights: check financials, spot patterns, read the mood, and avoid common traps. That’s how you turn research into real confidence.
Whether you’re just starting out or levelling up your investing game, the right approach and resources can make all the difference.
Disclaimer
This blog is for educational purposes only and does not constitute investment advice, an offer to buy/sell securities, or a recommendation. Past performance is not indicative of future results. Investors should consult a SEBI-registered advisor before making decisions. Mention of third-party entities is for illustration only and not an endorsement.
Readers are advised to consult their financial advisors or conduct independent research before making any investment decisions. Past performance is not indicative of future results. MNCL is a SEBI-registered intermediary (SEBI Registration No: INZ000008037). For further details, visit www.sebi.gov.in.



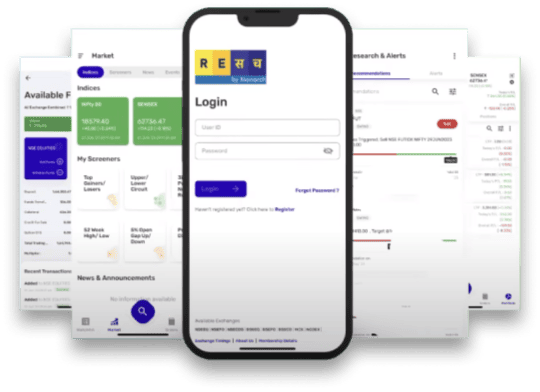
Empower your finances with ReSach – the stock trading apptrusted by serious investors. Whether you're planning to invest in stocks, explore commodity trading, or need a financial advisor to guide you, Resach brings it all under one platform.
Start trading today with ReSach and unlock seamless investing on the go.
Name of the Company has changed from Networth Stock Broking Limited to Monarch Networth Capital Limited upon Certification of Incorporation received from Registrar of Companies, Mumbai vide certificate dated 13th October, 2015.
If you are not satisfied with the resolution provided, you can lodge your complaint online at: https://scores.sebi.gov.in/link
In case of grievance client can log on to the SMART ODR Portal, if they are unsatisfied with the response provided by us. Your attention is drawn to the SEBI circular no. SEBI/HO/OIAE/OIAE_IAD-1/P/CIR/2023/131 dated July 31, 2023, on “Online Resolution of Disputes in the Indian Securities Market”.
Purchase of REs only gives buyer the right to participate in the ongoing Rights Issue of the concerned company by making an application with requisite application money or renounce the REs before the issue closes. REs which are neither subscribed by making an application with requisite application money nor renounced, on or before the Issue closing date shall lapse and shall be extinguished after the Issue closing date. Please check your dp account for further details.
Please do not share your online trading password with anyone as this could weaken the security of your account and lead to unauthorized trades or losses.
Monarch Networth Capital Limited (‘MNCL’) | CIN No.: L64990GJ1993PLC120014
Unit No. 803-804A, 8th Floor, X-Change Plaza, Block No. 53, Zone 5, Road-5E, Gift City, Gandhinagar - 382050, Gujarat
Ahmedabad
“Monarch House”, Opp Prahladbhai Patel garden, Near Ishwar Bhuvan, Commerce Six Roads, Navrangpura, Ahmedabad - 380009
Mumbai
Monarch Networth Capital Limited, G Block, Laxmi Tower, B Wing, 4th Floor, Bandra Kurla Complex, Bandra East, Mumbai - 400051.
Email for Grievance: grievances@mnclgroup.com
Investors are requested to note that Stock broker (Monarch Networth Capital Ltd) is permitted to receive money from investors through designated bank accounts only named as Up streaming Client Nodal Bank Account (USCNBA). Stock broker (Monarch Networth Capital Ltd) is also required to disclose these USCNB accounts to Stock Exchange. Hence, you are requested to use following USCNB accounts only (Click to View) for the purpose of dealings in your trading account with us. The details of these USCNB accounts are also displayed by Stock Exchanges on their website under “Know/ Locate your Stock Broker".
Mechanism for addressing grievances and information about SCORES.
Monarch Networth Capital IFSC Private Limited (Wholly owned subsidiary of Monarch Networth Capital Limited) is a Registered Fund Management Entity (Retail) having Registration No: IFSCA/FME/III/2025-26/169. Monarch India Growth Fund will be an open-ended Restricted Scheme (Non-Retail) construed as a Category III AIF under the IFSCA (Fund Management) Regulations, 2025. Monarch AIF is a Category III AIF having SEBI Registration No. IN/AIF3/20-21/0787. This material is for informational purposes only and is not intended as an offer or solicitation or investment advice to buy or sell securities. Investments are subject to market risks. The offering is made only through official scheme documents to eligible investors under GIFT IFSC regulations. Investors should read all documents carefully and consult their advisors before investing.
Mechanism for addressing grievances and information about SCORES.
Monarch Networth Capital Limited (‘MNCL’) | CIN No.: L64990GJ1993PLC120014
(As per LODR Regulations and Companies Act, 2013)
Contact information of the designated officials of the listed entity who are responsible for assisting and handling investor grievances : Mr. Nitesh Tanwar
Monarch Networth Capital Limited
Unit No. 803-804A, 8th Floor, X-Change Plaza, Block No. 53, Zone 5, Road-5E, Gift City, Gandhinagar - 382050, Gujarat
Ahmedabad
“Monarch House”, Opp Prahladbhai Patel garden, Near Ishwar Bhuvan, Commerce Six Roads, Navrangpura, Ahmedabad – 380009
Mumbai
Monarch Networth Capital Limited, G Block, Laxmi Tower, B Wing, 4th Floor, Bandra Kurla Complex, Bandra East, Mumbai - 400051.
Phone: 022 - 66476400 / 66476405
Email: cs@mnclgroup.com
Email for Grievance: cs@mnclgroup.com
Listing of Equity Shares on Stock Exchange at
BSE
NSE
(Formerly known as Link Intime India Private Limited)
For any queries related to broking please contact helpdesk@mnclgroup.com.
‘Investments in securities market are subject to market risks, read all the related documents carefully before investing.’