

HCL Technologies Ltd.- Stock Investment Idea Weekly Pick
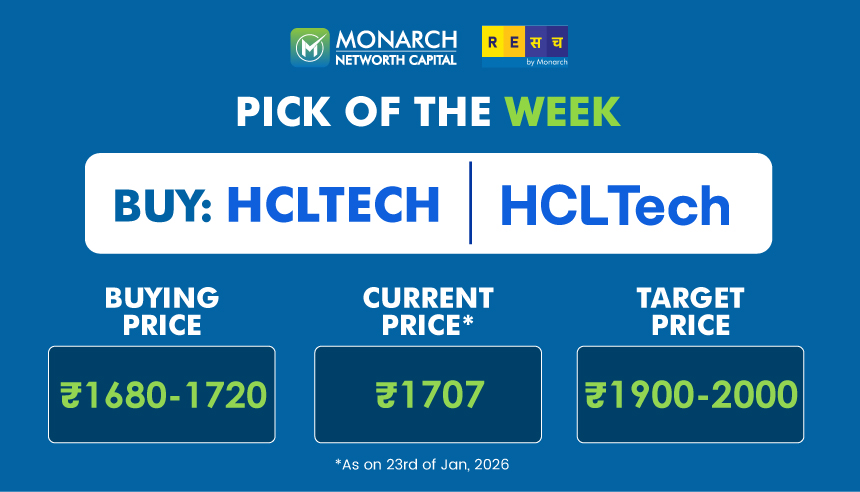
HCL Technologies Ltd. presents a high-conviction swing trading opportunity after a healthy correction from its all-time high. The stock is forming higher bottoms, trading above anchored VWAP and 50-week EMA, with RSI and MACD confirming momentum. A cup & handle breakout could drive a 17% upside over 10–12 weeks.
Expert recommendation by Mr. Ketan Kaushik - Derivative Analyst (NISM - 202200162803)
- Current Price: 1707
- Buying Price: 1680-1720
- Target Price: 1900-2000
- Stop loss: 1550
- Upside: 17%
- Timeframe: 10-12 Weeks
Stock Technical Analysis
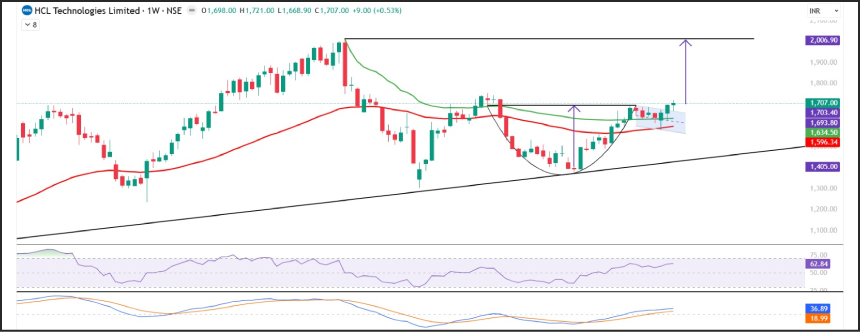
- The stock witnessed a sharp upward move from the 1235 level and made an all-time high of 2012 in JAN25; after making the high, it retraced to the previous support level and took support in the 1400-1500 zone.
- After the correction the stock has been making higher bottom formation and on the weekly chart and it has also closed above the anchored VWAP, indicating buying interest supported by volumes
- The stock has closed above the 50-week exponential moving average, and it is on the verge of breakout from a cup & handle chart pattern formation
- The momentum indicator RSI is sustaining above the 60 level on both the daily and weekly charts, and MACD is trading above 0 level on the weekly chart indicating that upside momentum is likely to continue in the coming days.
Traders can look to accumulate HCLTECH in the 1680-1720 zone and expect upside targets of 1900-2000 over the next 10-12 weeks, with a stop loss below 1550 on a closing basis.
💡 Learn to find more such setups with our swing trading guide to stay ahead of market opportunities.
Know more about HCL Technologies Ltd.
Website: https://www.hcltech.com/
HCL Technologies is a leading global IT services company with strong exposure to digital transformation, cloud, engineering services, and enterprise technology. Its resilient client base and execution consistency make it a preferred large-cap IT play during sector rotations and technical breakouts..
HCL Technologies Ltd. Swing Trading – Key Investor FAQs
Investors tracking large-cap IT stocks for swing trading often look for a combination of strong technical structure, momentum confirmation, and defined risk-reward. Below are key FAQs on HCLTECH’s current setup.
1. Why is HCLTECH considered a swing trading opportunity now?
After correcting from its all-time high, HCLTECH has formed higher bottoms and reclaimed key technical levels, indicating accumulation and trend resumption.
2. What technical indicators support the bullish view?
The stock is trading above the anchored VWAP and 50-week EMA, with RSI holding above 60 on both daily and weekly charts, and MACD remaining positive on the weekly timeframe.
3. What chart pattern is forming in HCLTECH?
HCLTECH is on the verge of a cup & handle breakout, a bullish continuation pattern that often precedes strong upside moves when supported by volume.
4. What is the ideal buying range and risk management?
Traders may accumulate in the 1680–1720 zone, targeting 1900–2000 over the next 10–12 weeks, with a stop loss below 1550 on a closing basis.
5. Is this trade suitable for short-term or long-term investors?
This setup is best suited for swing traders with a medium-term horizon, while long-term investors may use dips to build exposure in a fundamentally strong IT leader.
Before You Trade, Strengthen Your Foundations with These Guides
- For a stronger understanding of indicators such as RSI, VWAP, and trendlines, check our 👉 Technical Analysis Fundamentals section.
- Want to refine your risk-reward planning? Explore our insights on 👉 Position Sizing & Risk Management Strategies.
Disclaimer: - Investments in securities market are subject to market risk, read all the related document carefully before investing. https://www.mnclgroup.com/research-disclaimer