We maintain Buy with revised target price at Rs 380. Redington delivered a strong topline growth led by robust performance in the SSG segment along ESG on the back of refresh cycle seen in PCs. TSG saw some de-growth on the back of large deals and slower demand in on-prem to cloud. Mobility continued to deliver on the back of premiumization trend and strong numbers from Apple. Working capital days were at 28 days, 5 days lower YoY. Losses for Arena were lower at Rs 2.2 Bn and it was EBITDA positive for the first time. We model 15.3% revenue growth over FY25–28E, backed by strong tailwinds seen across SSG, MSG and ESG.
SSG delivered yet another 40%+ growth quarter on the back of strong demand seen in cloud, cybersecurity and managed services. ESG delivered 21%+ growth on the back refresh cycle seen in PCs along with component shortage which led to inventory stocking by channel partners. TSG was sluggish on the back of large deals, and we expect this trend to continue for a few quarters. MSG continues its impressive growth on the back of market share gains for Apple amid subdued growth in Android.
Working capital days were at 28 vs 33 YoY. ROCE stood at 22.1% vs company average of 18% on the back of larger share of SSG & better working capital management. Losses from Arena narrowed qoq and we expect Arena to be PAT positive by Q1FY27e. Interest cost and factoring costs have also come down YoY, which boost PAT margins by 14 bps. Large deals in TSG dampened gross margins along with some business slippage seen due to Arena. We expect EBITDA margins to improve by 15-20 bps over the few quarters.
Redington continues to be the leader in the distribution space in India and middle east. We expect the company to continue growing at 15% over the next few quarters given the tailwind it is seeing across SSG, ESG and MSG. Data centers is a large opportunity and could drive revenue growth over the next few years albeit putting some pressure on margins. Operationally we expect 18%+ return ratios with industry leading cash flow generation and working capital management.
We are factoring in 15.3%/16.7%/24.3% Revenue/EBITDA/PAT over FY25-FY28E, and value the company at 14x Q3FY28 PE, resulting in a TP of Rs 380. We have upgraded our revenue estimates by 4%, while cutting our EPS by 6% CAGR over FY27/28e on the back of lower margins due to large deals in TSG. Our base case estimates do not factor any acquisitions.
Key risks: vendor concentration (Apple, HP, AWS, Microsoft), sudden dip in component prices leading to inventory pile up, increase in losses from Arena.
Company website: https://redingtongroup.com/
| Rating | BUY |
|---|---|
| CMP* | INR 266 |
| Target Price | INR 380 |
| Upside | 53% |
*CMP is as per report published date

Click to download the full Redington Ltd Q3FY26 Company Update
Here are quick answers to common investor questions about the Redington investment opportunity, including entry levels, targets and key risks.
Traders can consider accumulating the stock near the ₹250–275 zone based on current price action and support levels.
A stop loss below ₹220 on a closing basis is recommended to manage downside risk.
Strong growth in cloud and cybersecurity (SSG), PC refresh demand (ESG), premiumization in mobility led by Apple, and improving return ratios support positive sentiment.
Vendor concentration risk, inventory fluctuations due to price changes, margin pressure from large deals, or higher losses from the Arena business could impact performance.
Disclaimer: - Investments in securities market are subject to market risk, read all the related document carefully before investing. https://www.mnclgroup.com/research-disclaimer



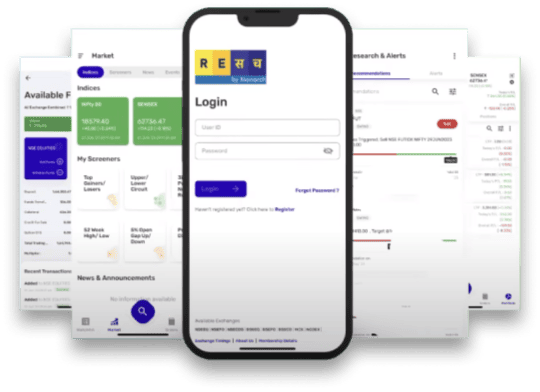
Empower your finances with ReSach – the stock trading apptrusted by serious investors. Whether you're planning to invest in stocks, explore commodity trading, or need a financial advisor to guide you, Resach brings it all under one platform.
Start trading today with ReSach and unlock seamless investing on the go.
Name of the Company has changed from Networth Stock Broking Limited to Monarch Networth Capital Limited upon Certification of Incorporation received from Registrar of Companies, Mumbai vide certificate dated 13th October, 2015.
If you are not satisfied with the resolution provided, you can lodge your complaint online at: https://scores.sebi.gov.in/link
In case of grievance client can log on to the SMART ODR Portal, if they are unsatisfied with the response provided by us. Your attention is drawn to the SEBI circular no. SEBI/HO/OIAE/OIAE_IAD-1/P/CIR/2023/131 dated July 31, 2023, on “Online Resolution of Disputes in the Indian Securities Market”.
Purchase of REs only gives buyer the right to participate in the ongoing Rights Issue of the concerned company by making an application with requisite application money or renounce the REs before the issue closes. REs which are neither subscribed by making an application with requisite application money nor renounced, on or before the Issue closing date shall lapse and shall be extinguished after the Issue closing date. Please check your dp account for further details.
Please do not share your online trading password with anyone as this could weaken the security of your account and lead to unauthorized trades or losses.
Monarch Networth Capital Limited (‘MNCL’) | CIN No.: L64990GJ1993PLC120014
Unit No. 803-804A, 8th Floor, X-Change Plaza, Block No. 53, Zone 5, Road-5E, Gift City, Gandhinagar - 382050, Gujarat
Ahmedabad
“Monarch House”, Opp Prahladbhai Patel garden, Near Ishwar Bhuvan, Commerce Six Roads, Navrangpura, Ahmedabad - 380009
Mumbai
Monarch Networth Capital Limited, G Block, Laxmi Tower, B Wing, 4th Floor, Bandra Kurla Complex, Bandra East, Mumbai - 400051.
Email for Grievance: grievances@mnclgroup.com
Investors are requested to note that Stock broker (Monarch Networth Capital Ltd) is permitted to receive money from investors through designated bank accounts only named as Up streaming Client Nodal Bank Account (USCNBA). Stock broker (Monarch Networth Capital Ltd) is also required to disclose these USCNB accounts to Stock Exchange. Hence, you are requested to use following USCNB accounts only (Click to View) for the purpose of dealings in your trading account with us. The details of these USCNB accounts are also displayed by Stock Exchanges on their website under “Know/ Locate your Stock Broker".
Mechanism for addressing grievances and information about SCORES.
Monarch Networth Capital IFSC Private Limited (Wholly owned subsidiary of Monarch Networth Capital Limited) is a Registered Fund Management Entity (Retail) having Registration No: IFSCA/FME/III/2025-26/169. Monarch India Growth Fund will be an open-ended Restricted Scheme (Non-Retail) construed as a Category III AIF under the IFSCA (Fund Management) Regulations, 2025. Monarch AIF is a Category III AIF having SEBI Registration No. IN/AIF3/20-21/0787. This material is for informational purposes only and is not intended as an offer or solicitation or investment advice to buy or sell securities. Investments are subject to market risks. The offering is made only through official scheme documents to eligible investors under GIFT IFSC regulations. Investors should read all documents carefully and consult their advisors before investing.
Mechanism for addressing grievances and information about SCORES.
Monarch Networth Capital Limited (‘MNCL’) | CIN No.: L64990GJ1993PLC120014
(As per LODR Regulations and Companies Act, 2013)
Contact information of the designated officials of the listed entity who are responsible for assisting and handling investor grievances : Mr. Nitesh Tanwar
Monarch Networth Capital Limited
Unit No. 803-804A, 8th Floor, X-Change Plaza, Block No. 53, Zone 5, Road-5E, Gift City, Gandhinagar - 382050, Gujarat
Ahmedabad
“Monarch House”, Opp Prahladbhai Patel garden, Near Ishwar Bhuvan, Commerce Six Roads, Navrangpura, Ahmedabad – 380009
Mumbai
Monarch Networth Capital Limited, G Block, Laxmi Tower, B Wing, 4th Floor, Bandra Kurla Complex, Bandra East, Mumbai - 400051.
Phone: 022 - 66476400 / 66476405
Email: cs@mnclgroup.com
Email for Grievance: cs@mnclgroup.com
Listing of Equity Shares on Stock Exchange at
BSE
NSE
(Formerly known as Link Intime India Private Limited)
For any queries related to broking please contact helpdesk@mnclgroup.com.
‘Investments in securities market are subject to market risks, read all the related documents carefully before investing.’